Interaction & Physicalization
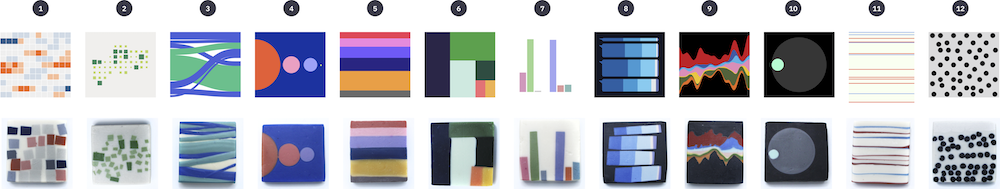
P. Ruchikachorn and N. Supavong, Exploring Handmade Soap as a Visualization Medium, PacificVis Posters, Tianjin, China, 2021.
🖼 Poster
📄 Preprint
We ordered handmade soaps to visually reflect 12 digital visualization designs in our previous work. The soap colors precisely matched the designs while the shapes varied. Our expectations of the 12 designs did not match the soap maker’s evaluations. Their comments were noted for picking designs suitable for soap making in the future. This can be helpful for further explorations of other physical materials for visualization, especially in every objects.
🕹 Demo: The parallel coordinates plot interface is available as an online tool at http://puripant.github.io/sketchpad-nd/
P. Ruchikachorn, B. Wang, and K. Mueller, SketchPadN-D: An Interface for High-Dimensional Dataset Generation and Editing, Poster presented at IEEE Information Visualization Conference (InfoVis), Seattle, Washington, USA, 2012.
📄 Preprint
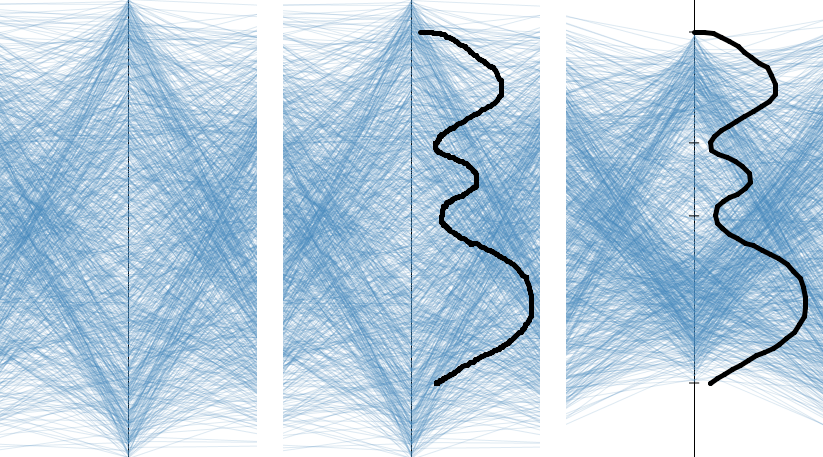
In order to generate data with known and desired features for high-dimensional data testing, we propose a tool that allows users to generate multivariate data directly within the same interface they would also use to visualize the data. We demonstrate our ideas with two well-established visualization paradigms, one based on the parallel coordinate framework, the other based on scatterplots.
B. Wang, P. Ruchikachorn, and K. Mueller, SketchPadN-D: WYDIWYG Sculpting and Editing in High- Dimensional Space, IEEE TVCG, vol. 19, no. 12, Dec. 2013.
📊 Slides
High-dimensional data visualization has been attracting much attention. To fully test related software and algorithms, researchers require a diverse pool of data with known and desired features. Test data do not always provide this, or only partially. Here we propose the paradigm WYDIWYGS (What You Draw Is What You Get). Its embodiment, SketchPadND , is a tool that allows users to generate high-dimensional data in the same interface they also use for visualization. This provides for an immersive and direct data generation activity, and furthermore it also enables users to interactively edit and clean existing high-dimensional data from possible artifacts. SketchPadND offers two visualization paradigms, one based on parallel coordinates and the other based on a relatively new framework using an N-D polygon to navigate in high-dimensional space. The first interface allows users to draw arbitrary profiles of probability density functions along each dimension axis and sketch shapes for data density and connections between adjacent dimensions. The second interface embraces the idea of sculpting. Users can carve data at arbitrary orientations and refine them wherever necessary. This guarantees that the data generated is truly high-dimensional. We demonstrate our tool’s usefulness in real data visualization scenarios.